View graph as number or percentage in a custom report

Hey ! :slight_smile:

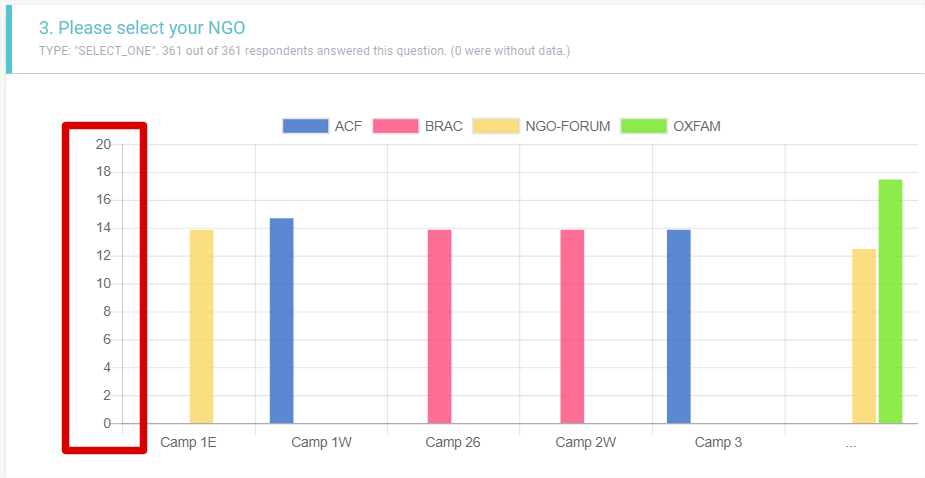
When you are using the KOBO data dashboard to view data you can not choose the type of scale you want to display. It should be interesting to improve Kobo data dashboard feature by giving the option to view data as numbers or percentages (and by default having the number rather than the %).

I am using KOBO Humanitarian response

This feature could allow easier data quality check. In fact, for some data you could have a better idea of results by using percentage.

Thanks to think about it
ChloΓ©

Upvoting this suggestion.

1 Like

Hello,
Wondering how many upvotes this ought to get before this feature can be implemented in Kobotoolbox. I only recently implemented Kobotoolbox for my organization and need a solution to represent the data that we collect as numbers rather than percentages when generating a report.
Are there any alternatives to achieve this? Could this be something that can be done with the KoBoToolbox Excel Data Analyser v1.23 for instance?